Lumistrips UK
 Lumistrips US
 Lumistrips ES
 Lumistrips ITA
LED Lifetime, Lumen Maintenance, and TCO for Greenhouse Operators of Grow Lights
-
 By
Lumistrips LED Professional
By
Lumistrips LED Professional
- Apr 28, 2026
Part of the Lumistrips Horticulture LED Series — a technical resource for growers, vertical farm operators, and horticultural engineers.
Why Lifetime and Cost Data Are the Most Misrepresented Metrics in Horticulture Lighting
When greenhouse operators evaluate LED lighting systems, two numbers appear in almost every specification sheet: lifetime (typically stated in hours) and energy cost savings (often expressed as a percentage versus HPS). Both numbers are frequently misleading, not because they are fabricated, but because they are presented without the context that makes them meaningful or comparable between products.
Consider lifetime. Among LED lighting manufacturers supplying the horticulture market, almost a third do not report lifespan data at all. Of those that do, nearly half fail to specify which lumen maintenance level the quoted lifetime refers to. A system quoted at "50,000 hours" might mean L70 (30% output degradation at that point), L80 (20% degradation), or L90 (10% degradation). These are not equivalent. An L70 system running at 40,000 hours has already lost 30% of its initial output — meaning the crop is receiving 30% less PPFD than it was at installation, with full operating costs still being paid. This is the reason why Lumistrips works only with the leading LED manufactureres, that provide complete and accurate lumen maintenance data.
Consider energy cost savings. The comparison is almost always made against HPS at equivalent PPF output. But the claimed savings depend entirely on the LED system's actual photosynthetic photon efficacy (PPE, in µmol J⁻¹), the operating hours per year, and the local electricity tariff — all of which vary by order of magnitude between installations. A savings claim without these parameters is not a prediction: it is an estimate that could be right or wrong by a factor of two.
This article provides greenhouse operators and vertical farm developers with the framework to evaluate LED lifetime and TCO claims on their own terms — using the correct metrics, with the correct questions, applied to the specific parameters of their operation. It also covers the engineering decisions Lumistrips makes to support the lifetime specifications our horticulture LED modules are designed to meet.
LED Lifetime: What It Actually Means
Lumen Maintenance: The Correct Definition of LED Life
Unlike incandescent bulbs, which fail catastrophically, LEDs degrade gradually. The LED does not suddenly stop working — its light output declines over time as the semiconductor junction and phosphor materials age under the combined stress of heat, current, and operating hours. The practical consequence for a horticulture installation is that the PPFD delivered to the crop progressively decreases from commissioning day, without any obvious failure event to signal that performance has deteriorated.
LED lifetime is therefore defined not by failure but by lumen maintenance which is the number of operating hours at which light output has declined to a specified percentage of its initial value. The three standard thresholds are the following:
- L90: 90% of initial output remaining = 10% degradation. The highest performance specification, appropriate for applications where PPFD precision is critical to crop yield and quality, or where the system will be operated for extended periods before any maintenance intervention.
- L80: 80% of initial output remaining = 20% degradation. The middle specification, common in commercial greenhouse applications where moderate PPFD decline over a multi-year operational cycle is acceptable.
- L70: 70% of initial output remaining = 30% degradation. The minimum specification commonly used in the general LED lighting market. In horticulture, L70 is increasingly considered inadequate for crop lighting applications, since a 30% PPFD decline below the design target has measurable yield and quality consequences for light-sensitive crops.
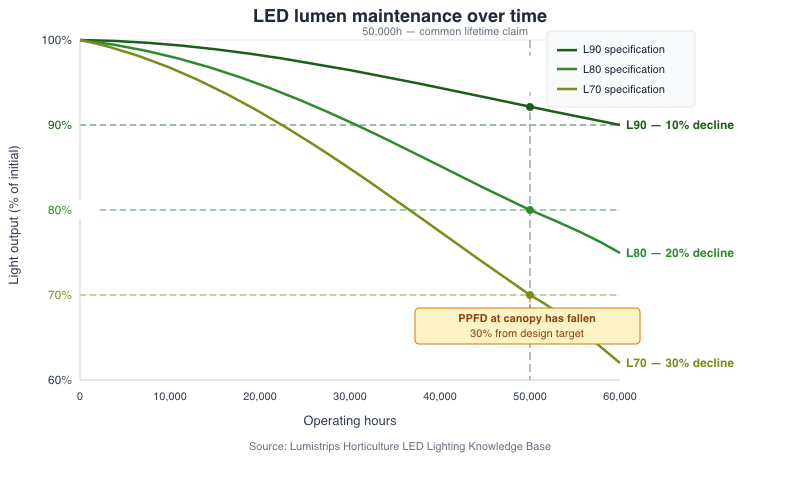
When a manufacturer quotes "50,000-hour lifetime" without specifying L70, L80, or L90, the number is meaningless for comparison purposes. Always ask which lumen maintenance level the lifetime figure refers to before accepting it as a specification.
IES LM-80: The Standard Behind the Numbers
Lumen maintenance projections are based on the IES LM-80 test standard, a protocol that measures LED package light output degradation at defined temperature setpoints over an extended test period. The test runs for a minimum of 6,000 hours, though 10,000-hour tests are increasingly standard among premium LED manufacturers.
The critical constraint in LM-80-based projections is that lumen maintenance extrapolations cannot exceed six times the duration of the actual test. An LED tested for 6,000 hours can have its maintenance curve projected to a maximum of 36,000 hours. An LED tested for 10,000 hours can be projected to 60,000 hours. This is why manufacturers who want to claim 50,000 or 60,000-hour L80 lifetimes must have completed at least 8,333 or 10,000 hours of LM-80 testing — a significant investment that tier-one LED manufacturers make and commodity manufacturers often do not.
Catastrophic Failure Rate (The B-Value) and What L80B50 Actually Means
Lumen maintenance such as L70, L80, L90 describes only one of two distinct ways an LED system degrades over time. It captures the gradual decline in light output as the semiconductor junction and phosphor materials age. It does not capture the second failure mode: catastrophic failure, where an individual LED or driver unit stops functioning entirely rather than simply dimming.
The B-value addresses this second dimension. It expresses the percentage of units in a population that will have failed catastrophically by a given number of operating hours. The most commonly cited values are:
- B10 = the point at which 10% of a population of LED units will have suffered catastrophic failure. A driver rated at B10/50,000h means that 10% of those drivers are statistically expected to fail completely within 50,000 hours.
- B50 = the point at which 50% of a population will have failed catastrophically. This is the statistical median life, the point at which half the units have stopped working. It is the same concept as the familiar MTTF (Mean Time To Failure) used in electronics reliability engineering.
When a manufacturer specifies L80B50, they are providing a combined lifetime statement: at the quoted number of hours, 80% of initial light output is maintained (L80), and 50% of the installed population has not yet suffered a complete failure (B50). Read together, this means that at the stated lifetime, a typical installation is simultaneously experiencing gradual lumen depreciation to 80% of its starting PPFD output and has statistically already lost half of its individual LED units to outright failure. This is a very different operational picture from what most buyers understand when they see a single "50,000-hour lifetime" figure.
The distinction matters because L and B values compound independently:
- A specification of L90B10/50,000h is a high-confidence, premium specification: at 50,000 hours, output has only declined 10%, and only 10% of units have failed. This is appropriate for precision vertical farming and research applications.
- A specification of L70B50/50,000h is a far weaker claim: at 50,000 hours, output has declined 30%, and half the installed population has already failed. In a greenhouse with hundreds of luminaires, this represents a substantial and potentially uneven PPFD reduction across the growing area, with significant operational disruption from failed units.
- L80B50 is the most common combined specification seen in commercial LED lighting, as it represents a middle ground that is widely used as the de facto market standard but should be understood as a median performance claim, not a guaranteed minimum.
Lumistrips designs horticulture LED systems to explicit L70, L80, or L90 targets that are specified at the project level in collaboration with the customer, and backed by LM-80 data from our LED component suppliers. The specific lifetime target is agreed upon before module design, as it has direct implications for component selection, drive current, and thermal management design. An L90/50,000h specification requires a different thermal design from an L70/50,000h specification at the same PPF output, lower drive currents and better heat dissipation to keep junction temperatures low enough for the tighter degradation target.
Why the B-Value Is Agronomically Significant for Greenhouse Operators
In most commercial LED applications such as office lighting, street lighting or retail, a small percentage of failed luminaires is an inconvenience managed through routine maintenance. In a horticulture context, particularly in a sole-source vertical farm, individual luminaire failures create something more consequential: localised PPFD deficits in specific growing tiers or zones.
A vertical farm tier operating under a failed LED bar receives dramatically reduced PPFD, potentially below the crop's minimum effective threshold, while neighbouring tiers continue at full output. This does not produce a uniform yield reduction across the facility; it produces a patchy, uneven crop with some trays running significantly behind the production schedule. For a vertical farm operating on tight harvest cycle timing and supplying produce to retail on defined delivery dates, this is an operational problem, not just a maintenance one.
The practical implication is that for horticulture, and especially for sole-source vertical farm applications, the B-value specification of both the LED module and the driver should be specified explicitly, alongside the lumen maintenance level. A driver B10 rating of 50,000h means that in a 1,000-luminaire vertical farm installation, approximately 100 driver failures are statistically expected within the first 50,000 operating hours. At 16 operating hours per day, that is within the first 8.5 years — a span that overlaps with the intended operational life of the facility.
Specifying drivers and LED modules with B10 (rather than B50) ratings at the target operating hour count and designing a maintenance plan accordingly, is the engineering response to this reality. At Lumistrips, driver specification is treated as a system-level reliability decision, not a procurement afterthought, with B-value ratings matched to the LED module's lumen maintenance target for each project.
Reading a Complete Lifetime Specification: A Practical Checklist
A complete, unambiguous LED lifetime specification for a horticulture application should provide all the following:
| Parameter | What to ask | Red flag |
|---|---|---|
| Lumen maintenance level | L70, L80, or L90? | No L-value stated — 45% of manufacturers omit this |
| Failure rate (B-value) | B10 or B50? For LEDs and drivers separately? | No B-value stated — most commodity suppliers omit this entirely |
| Operating hours | At what hour count do L and B values apply? | Unspecified — makes the figure unverifiable |
| LM-80 test duration | How many hours of actual test data back the projection? | Less than 1/6 of quoted lifetime — projection exceeds the standard's limit |
| Test temperature | At what junction temperature was the data measured? | 55°C test quoted for a system that will run at 85°C Tj |
| System vs. component | Does the specification apply to the LED package, the module, or the complete luminaire? | LED component lifetime quoted without driver and connector data |
A supplier who can answer all six questions with documented data, rather than estimated figures or marketing claims, is one whose lifetime specification is trustworthy for operational planning. At Lumistrips, for every horticulture LED module project we can provide, on request, the target L-value, B-value, and operating hour count at the design stage, with component selection and thermal design matched to meet them.
What Determines LED Lifetime in a Greenhouse Environment
The IES LM-80 test data establishes the potential lifetime of the LED package under controlled laboratory conditions. Real greenhouse installations introduce additional stresses that affect the system lifetime actually achieved. Understanding these factors is the basis for engineering a system that meets its lifetime specification in service, rather than only in the test chamber.
Junction Temperature: The Primary Lifetime Driver
The single most impactful operational parameter is LED junction temperature (Tj). The relationship is well-established: for every 10°C increase in Tj above the rated operating point, LED lifetime is approximately halved, while instantaneous light output decreases by 3–8%. This is not a marginal effect — it is exponential.
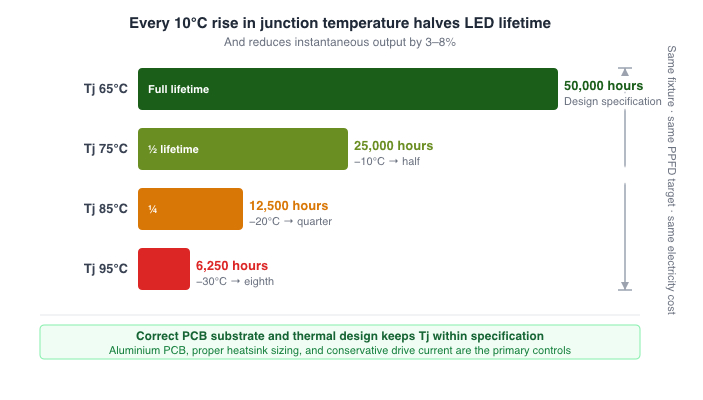
Consider a horticulture LED module designed for an operating Tj of 65°C. If inadequate thermal management raises the actual Tj to 85°C — a 20°C increase — the expected lifetime is reduced to approximately one-quarter of the design value. A system specified at L80/50,000h effectively becomes L80/12,500h under this thermal stress, representing a catastrophic shortfall against the operational plan.
Keeping Tj within specification under greenhouse operating conditions requires careful attention to three engineering layers: the LED component's thermal package design, the PCB substrate's thermal conductivity (where aluminium provides far superior performance over FR4 for high-power applications, as covered in our PCB substrate guide), and the luminaire's thermal management design — heatsink sizing, airflow provision, and the thermal interface between the LED module and the heatsink profile.
Drive Current: The Efficacy-Lifetime Trade-off
LED output increases with drive current, but so does junction temperature, and both lumen maintenance degradation rate and instantaneous efficacy change with current. There is a fundamental trade-off in every LED system design: running LEDs harder produces more light per fixture but shortens lifetime and reduces efficacy due to current droop (the well-documented phenomenon where LED efficiency decreases at higher current densities).
For horticulture applications running 16-hour photoperiods across a full growing season, approximately 5,800 hours per year, the operating hours accumulate quickly. A system running at conservative drive currents (50–80% of maximum rated current) will outlast a system running at 95% of rated current by a factor of two or more at the same temperature, while also delivering better efficacy per watt due to reduced current droop. For greenhouse operators, the lower drive current option typically represents the correct long-term economic choice even if the initial PPF output per fixture is slightly lower, the difference can be compensated through additional fixtures or closer spacing, with the long-term maintenance cost reduction more than offsetting the capital difference.
Driver Efficiency and Reliability
The LED driver, the electronics that convert AC mains power to the DC current that powers the LEDs, is often the weakest link in the horticulture luminaire lifetime chain. Modern high-quality LED drivers achieve efficiencies of 85–95%, but driver reliability varies significantly between manufacturers and specification grades. A driver failure in a greenhouse luminaire at the two-year mark can negate the lifetime advantage of premium LED components if the driver is not designed and specified to an equivalent quality standard.
Driver lifetime is typically rated at a B10 figure, the operating hours at which 10% of a population of drivers will have failed. For greenhouse applications, B10 ratings of 50,000+ hours are the appropriate specification, matched to the LED system's lumen maintenance target. At Lumistrips, driver specification is treated as an integral part of the system design rather than a procurement afterthought.
Environmental Factors: Humidity, Temperature Cycling, and Corrosion
Commercial greenhouse environments are challenging for electronic systems. Relative humidity regularly exceeds 85–90%, condensation cycles occur with diurnal temperature variation, and hydroponic nutrient solutions generate salt aerosols that can be corrosive to exposed PCB surfaces and connector contacts. LED driver housings, PCB conformal coatings, IP-rated enclosures, and corrosion-resistant LED packages are all engineering responses to this operating environment that directly affect service lifetime.
Vertical farm installations add further challenges: UV light exposure from the LED sources, physical vibration from HVAC systems, and the regular contact with water during cleaning cycles. Each of these stresses must be accounted for in the system design if the published lifetime specification is to be achieved in service rather than just on paper.
Reading Lumen Maintenance Data: What to Ask Before You Buy
Given the data quality issues prevalent in the horticulture LED market, where many manufacturers either provide no lifetime data, or no lumen maintenance level, buyers need a systematic approach to evaluating lifetime claims. The following questions extract the information needed for a meaningful comparison.
1. What lumen maintenance level does the quoted lifetime refer to? L70, L80, or L90. If the answer is not immediately provided, request the full lumen maintenance data table, not just the headline hour figure.
2. What is the test duration underpinning the projection? LM-80 projections cannot exceed 6× the test duration. A 50,000-hour claim requires at least 8,333 hours of LM-80 test data. Ask for the actual test duration and test temperature.
3. At what junction temperature was the lifetime tested and projected? LM-80 tests are conducted at specific temperatures (typically 55°C, 85°C, and 105°C for high-power LEDs). The projection at 85°C junction temperature is much more conservative than at 55°C. Confirm that the test conditions are representative of actual installation conditions in the greenhouse environment.
4. Does the lifetime figure refer to the LED component, the LED module, or the complete luminaire system? These are not equivalent. The LED component may have an L80/50,000h specification, but the driver, connectors, and enclosure may limit the system lifetime to 30,000 hours in practice. System-level lifetime data is the relevant figure for installation planning.
5. What warranty period does the manufacturer provide, and what does it cover? A 5-year warranty backed by genuine lumen maintenance data is a materially different offer from a 5-year warranty on a product with no published LM-80 data. At Lumistrips, our standard product warranty is 5 years, with selected LED strip products carrying a 7-year warranty, figures we back with the LM-80 data and thermal design that make them achievable.
During the design process of a horticulture LED module, Lumistrips can provide comprehensive answers to all these questions.
From Lifetime to PPFD: The Agronomic Consequence of Lumen Decline
Lumen maintenance data is typically presented in the context of illumination — what percentage of light output remains. For horticulture, the relevant translation is: what percentage of initial PPFD remains at the crop canopy, and what are the yield consequences of that decline?
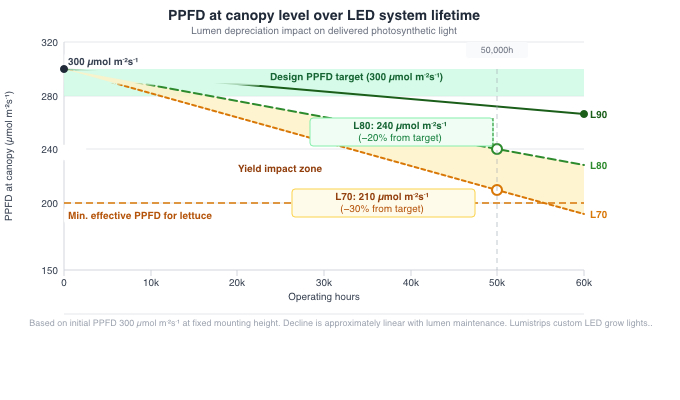
The relationship between lumen maintenance and PPFD decline is approximately linear for fixed-installation luminaires at fixed mounting heights. An L80 system at 50,000 hours delivers 80% of its initial PPFD. If the initial design PPFD was 300 µmol m⁻² s⁻¹, the PPFD at 50,000 hours is approximately 240 µmol m⁻² s⁻¹ — a decline of 60 µmol m⁻² s⁻¹.
Whether this matters agronomically depends on the crop and its light response curve. For leafy greens with a light saturation point around 300 µmol m⁻² s⁻¹, the decline from 300 to 240 µmol m⁻² s⁻¹ produces a measurable reduction in photosynthesis rate and yield. For a high-wire crop where the target PPFD is 800 µmol m⁻² s⁻¹ and 640 µmol m⁻² s⁻¹ at L80 is still above the light saturation point, the practical yield impact may be smaller.
The design implication is clear: for light-sensitive crops where PPFD precision directly drives yield, L90 specifications at commercially meaningful hour counts are the correct engineering choice, even at higher initial system cost. For less light-sensitive applications, L80 may be adequate. Specifying L70 for professional horticulture LED systems is increasingly difficult to justify on agronomic grounds.
Total Cost of Ownership: Building the Correct Calculation
Total Cost of Ownership (TCO) is the correct framework for evaluating horticulture LED systems. It accounts for all costs incurred over the operational life of the installation and not just the purchase price.
The TCO Components
A complete TCO calculation for a greenhouse LED lighting installation includes the following cost categories:
- Initial capital cost: Fixture procurement, installation labour, wiring and electrical infrastructure, dimming and control systems.
- Energy cost: Electricity consumed by the luminaires across the operational lifetime, at the applicable electricity tariff, accounting for operating hours per year and any reduction through daylight harvesting or dimming control.
- Maintenance cost: Driver replacement, cleaning, module replacement if required before end-of-life, and the cost of crop yield losses during maintenance periods when lighting is unavailable.
- End-of-life replacement cost: The cost of replacing the system at end of its service life, including disposal or recycling of the old system.
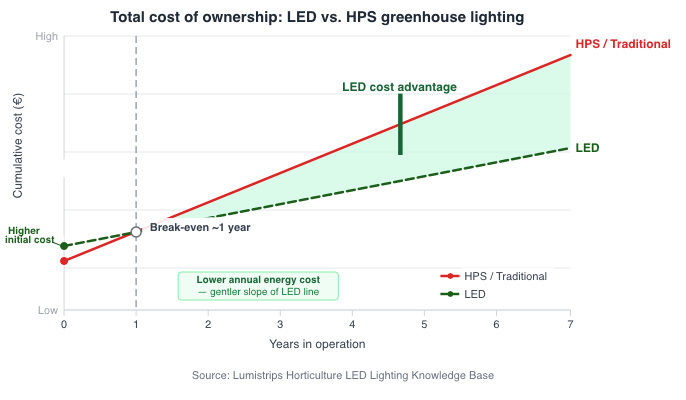
In the full TCO comparison between HPS and LED, and between different LED systems, energy cost typically dominates the calculation over a 7–10 year operational horizon. The below sample Lumistrips analysis comparing five LED combination variants producing equivalent photosynthetic photon flux output demonstrates that energy cost — driven directly by system efficacy (µmol J⁻¹) — is the primary lever. LED fixtures can reach break-even versus traditional HPS fixtures after as little as one year of operation, with the cumulative energy cost advantage compounding significantly over a multi-year lifespan.
LED vs. HPS: The TCO Case
The fundamental TCO case for LED over HPS in horticulture is well-established. HPS lamps convert only approximately 30% of electrical energy into usable light, with the remainder dissipated as heat — radiant heat that also adds to the greenhouse cooling load in summer, representing a further indirect energy cost. LED systems convert approximately 50% of electrical energy into light, and emit negligible radiant heat directly onto the canopy.
The comparative study most frequently cited in the horticulture industry found that greenhouse tomato growers could achieve equivalent crop yields using LED supplemental lighting while consuming only 25% of the energy required by traditional HPS lighting. At a European commercial electricity tariff of €0.15–0.25/kWh, and a greenhouse with several hundred luminaires running 16-hour photoperiods across a 7-month growing season, the annual electricity cost difference between an HPS and LED installation is substantial, often sufficient to recover the LED capital premium within 12–18 months of operation.
The break-even calculation is installation-specific and depends critically on three variables: the actual system PPE of the LED installation (µmol J⁻¹), the comparable PPE of the HPS installation being replaced (typically 1.6–1.7 µmol J⁻¹ for modern HPS), and the local electricity tariff. Operators with access to grid electricity at €0.20/kWh will see faster break-even than those on €0.10/kWh; operators replacing older or less-efficient HPS will see faster break-even than those replacing modern top-performing HPS.
The TCO comparison does not end with LED versus HPS. Within LED systems, the component choices that determine system PPE have a direct and quantifiable impact on TCO over the operational life of the installation.
An analysis of five LED combination variants, all producing 2,000 µmol sPPF, demonstrates this clearly. At the same PPF output, Variant 1 consumes 518 W and Variant 5 consumes 784 W, a difference of 266 W per fixture. For a greenhouse installation running 1,000 such fixtures at 16 hours per day for 300 growing days per year, the annual energy difference between Variant 1 and Variant 5 specifications is approximately 1,277,000 kWh. At €0.20/kWh, this is a €255,000 annual energy cost difference for the same crop lighting output.
The TCO curves diverge further over time: the higher-efficacy system costs less to run annually and generates less heat (improving greenhouse climate management) and places less thermal stress on the LED components (extending operational lifetime and deferring replacement cost). These compounding effects make the TCO case for higher-efficacy LED component selection stronger than any single-year energy cost comparison conveys.
Energy Use and Efficacy: Benchmarking Your System
For greenhouse operators evaluating their current LED installation or specifying a new one, the efficacy benchmark data from Lumistrips' database of LED lighting systems provides a useful reference point. The majority of LED lighting systems in this database present efficacy values between 2.0 and 4.0 µmol J⁻¹ (70% of all systems), with linear LED modules and strips, the dominant format for supplemental greenhouse lighting, showing the highest average efficacy values of 2–3+ µmol J⁻¹.
The theoretical maximum efficacy for a system built with 90% red diodes and 10% blue diodes is approximately 4.1 µmol J⁻¹, a ceiling that current technology is approaching but has not yet reached at commercial scale. In practice, Lumistrips designs most horticulture LED systems to achieve 2.5–4.0 µmol J⁻¹ at the system level, depending on the spectral requirements of the crop and the balance between efficacy, budget and spectral completeness.
Comparing a quoted system PPE against this benchmark distribution provides a rapid sanity check: a system quoted at 1.8 µmol J⁻¹ is below the market average and likely represents an outdated design or component selection; a system quoted at 3.5+ µmol J⁻¹ represents high-performance engineering that will deliver meaningful TCO advantages over a multi-year operational life.
The Hidden Cost: Lumen Depreciation and Yield Impact
There is a cost in the TCO calculation that almost no horticulture LED supplier quantifies but that every grower experiences: the yield impact of progressive PPFD decline over the system lifetime.
As discussed above, an L80 system at end-of-life delivers 80% of its initial PPFD. For a system running since commissioning at a PPFD target matched to the crop's light saturation point, the final years of operation are conducted at a PPFD that is systematically below target — with measurable consequences for crop yield, cycle duration, and quality consistency.
Operators can respond to this in two ways. They can overspec the initial PPFD target, designing the system to deliver 20–25% above the minimum target PPFD at commissioning, so that the system is still at the minimum target at L80 end-of-life. This approach has a capital cost premium but preserves consistent agronomic performance across the system lifetime. Alternatively, they can install dimming-capable systems and progressively increase the drive current as the system ages, compensating for lumen depreciation while maintaining target PPFD, though this approach reduces the remaining lifetime of the LED components as drive current increases.
The correct strategy depends on the crop's sensitivity to PPFD variation, the operator's capital budget, and the planned replacement cycle for the system. For premium crops where consistent yield and quality are commercially critical, the overspecification strategy is generally the better investment. For less light-sensitive applications, progressive dimming compensation is a practical and cost-effective approach.
How Lumistrips Approaches Lifetime and TCO Engineering
At Lumistrips, lifetime specification is an explicit engineering input to every horticulture LED module project, not an output that is calculated after the design is fixed. The process begins with the customer's operational requirements: target PPFD, growing season operating hours, planned system lifetime, maintenance access and schedule, and the specific growing environment. From these inputs, the target lumen maintenance level (L70, L80, or L90) and the target operating hour count are defined as design specifications.
These specifications drive the thermal design: the LED component, drive current, PCB substrate, and heatsink are sized to keep junction temperatures within the range that achieves the target lumen maintenance, verified against the LM-80 data for the specific LED components selected. Where a customer specifies L90/50,000h for a precision leafy green vertical farm, the design will use lower drive currents, aluminium PCB substrate, and more aggressive thermal management than a system specified at L70/40,000h for a supplemental lighting application where more frequent replacement is acceptable.
The result is a system where the stated lifetime target is achievable in the actual greenhouse or vertical farm environment, not just in a test chamber, and where the TCO calculation presented to the customer reflects real operating conditions rather than best-case laboratory projections.
We design as standard for a product warranty of 5 years and up to 10 years in some cases. This reflects our confidence in the thermal design and component quality of our horticulture LED modules. These are not marketing figures; they are the direct consequence of designing to explicit lifetime specifications with component data and thermal analysis to back them up.
Want a TCO analysis for your horticulture LED project?
Lumistrips can provide a full Total Cost of Ownership analysis for greenhouse and vertical farm LED lighting projects, including energy cost modelling, lumen maintenance projections, and payback period calculation based on your specific operating parameters. Talk to our horticulture lighting engineers.
← Back to the series: LED Lighting for Horticulture — The Complete Engineering Guide
Sources: Lumistrips Horticulture LED Knowledge Base; IES LM-80 LED Lumen Maintenance Standard; ASABE S640/S642 Horticulture Luminaire Standards.